A taste of geospatial analysis for competition economics

Share
Written by Ivana Kocanova, James Forster and Toby Howard
Geospatial analysis is a key parameter of the assessment of mergers where competition takes place at the local level. In this article, the data science team explores the tools it has developed to collect, analyse and visualize the data, quickly and flexibly. These tools enable better analysis of the actual competitive pressures in local markets, and thus better decisions by firms and competition authorities.
Introduction: geospatial analysis in competition economics
Geospatial analysis is the process of combining geographic information (e.g. locations) and economic or business data to answer questions and make decisions through the use of mapping, statistics or modelling.
In the context of competition cases, it allows us to show intuitively abstract concepts such as local market concentration, location-based demand clustering and the direct impact of entry and exit into a local market. These can then be key inputs in determining, for instance, how a merger between two firms will affect local competition.
Compass Lexecon’s expertise is frequently sought in merger proceedings relating to assessments of competition at a local level (e.g., mergers between pubs, car dealers, retailers, etc.). Based on our experience, we have developed a series of tools to conduct geospatial analyses at scale, quickly and flexibly.
In this article, we describe the challenges faced in performing geospatial analysis and the techniques that we have developed to overcome them.
Collecting the ingredients
The main inputs for a geospatial analysis of competition are the coordinates (latitude and longitude) of the company’s points of sale and those of its competitors. However, there are two typical difficulties in collecting these data:
Lack of data on the precise coordinates of a point of sale.We describe these below, as well as the technical skills and in-house tools that the Compass Lexecon data science team has developed to overcome these challenges efficiently.
Data on competitors’ locations
While companies tend to know the locations of their own points of sale, they do not always hold information on those of their competitors. In some cases, it is possible to obtain this information from competitors’ websites. But the manual review required to extract this information can be very time consuming, especially when there are many websites to access.
We have therefore developed expertise in web-scraping. This allows us to extract quickly all key information available from a given website. This potentially includes information on the location of points of sale and the services offered, which can then be used for the geospatial analysis.
Lack of precise coordinates
Data on the coordinates associated to a given location are not always available. Instead, the location of a given point tends to be recorded in more standard business-friendly formats, such as addresses, postcodes and place names. As above, it is often possible to infer the coordinates of an address through desktop research, but this quickly becomes a burdensome exercise.
Instead, our geospatial tools provide functionalities, known as geocoding, to convert addresses efficiently into geographic coordinates (such as latitude and longitude), turning days of manual work into minutes. They rely on a matching algorithm which determines the location of the input address over the range of addresses in a reference dataset. Using a dataset of known geographic coordinates, such as a street address database, the algorithm tries to find the closest match for the input address to locations in the dataset.[1]
Pairwise analysis
Once all the spatial coordinates have been collected for the company and all the competitors we seek to analyse, we can estimate how close the locations are to each other. This process is known as pairwise analysis, where we measure the distance or transport time between pairs of coordinates. Our tools use specialized APIs [2] which allow us to use route-finding tools (similarly to Google Maps) that can estimate the average travel distance for a given pair of locations.
A common challenge when conducting pairwise distance analysis is the increasing computational complexity as we start to consider a greater number of locations.
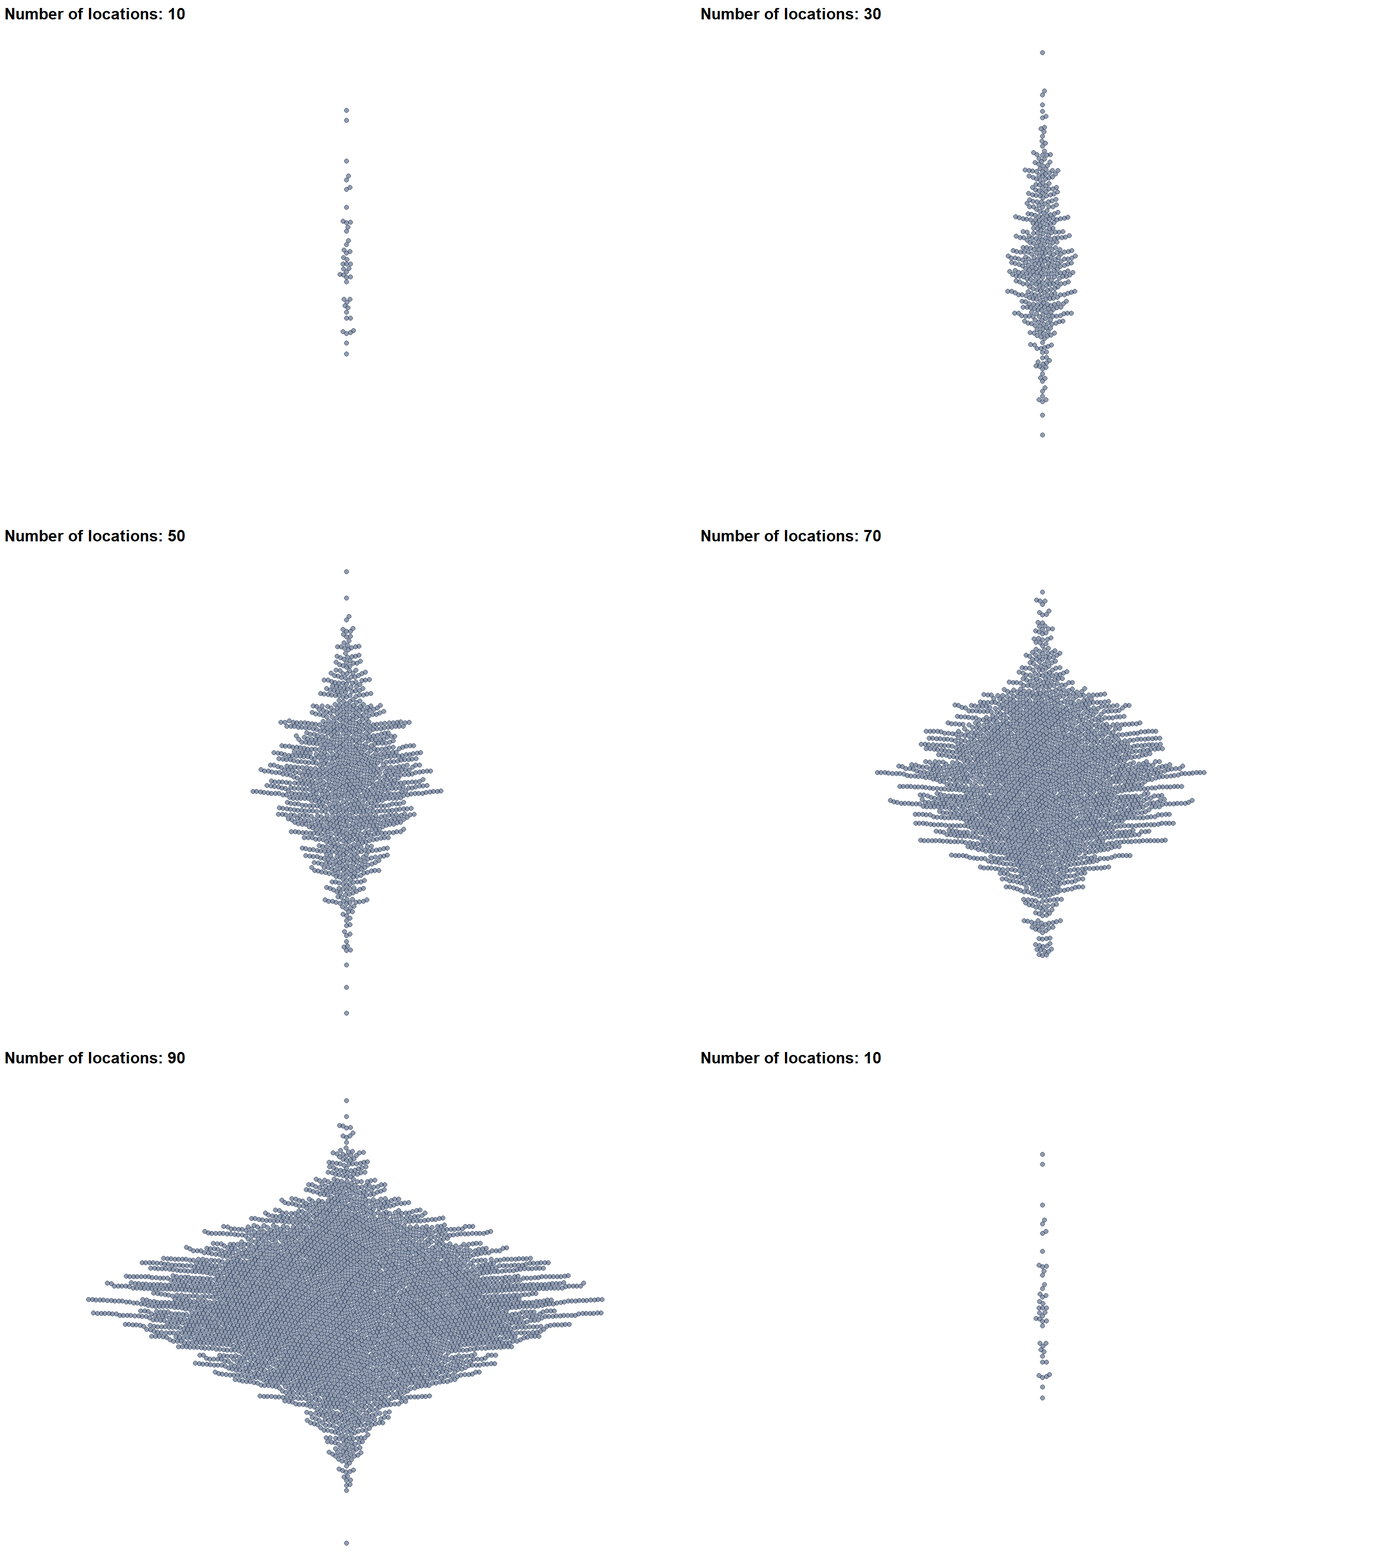
For instance, if we use just 10 locations, we only need to conduct 45 pairwise comparisons. But as we increase this to 50 locations, we are conducting more than 1,000 comparisons. This number continues to grow rapidly as the number of locations being assessed grows, as shown in the illustrative example below (Figure 1).
To reduce as much as possible this computational complexity, our tools include pre-filtering options that remove location pairs that exceed a specified distance threshold. This reduces the number of location pairs that require precise driving distance calculations, enabling more efficient analysis.
Figure 1: Increasing the number of locations exponentially increases the number of calculations

Together, the tools we have developed enable us to collect coordinates and analyse them, by computing the distance or transport time between each of the point of sale relevant for the analysis.
Catchment if you can: who buys from each store?
Once we have the spatial coordinates of a site, we can determine the geographic reach of its customer base, also known as the site’s catchment area. This is determined by the distance customers are willing to travel to reach the site. In practice, catchment areas can be defined in multiple ways, with the exact definition typically being highly case-specific.[3]
While catchment areas often are a key ingredient, they are not the be-all and end-all of the assessment of competition at the local level. For instance, online retailers may exert competitive pressure on a point of sale while being absent from its catchment area (as, by definition, online retailers do not have brick-and-mortar points of sale).
The simplest proxy to represent a catchment area is a straight line (or “as the crow flies”) distance around the point of sale. For example, suppose that we have a high-street retailer, Arepa Ltd, which sells bread. We assume that Arepa’s catchment area consists of all customers within a 1km radius around it. This is shown in Figure 2 below, in which we plot a 1-kilometre catchment radius around Arepa’s hypothetical store in Leeds in the UK.
Figure 2: Example 1km "as the crow flies" catchment area
Source: Compass Lexecon analysis based on hypothetical data
Although straight line distances might provide a good initial approximation for the catchment areas, they have one clear issue - people do not travel like crows! In some cases, catchment areas can look very different once we take into consideration roads, buildings, rivers, and other obstructions which might influence the customer’s journey. For this reason, our tools also allow us to look at the exact travel distance or time to reach a store, according to various means of travel. These catchment areas based on a travel distance or time metric are called “isochrones”.[4]
In the map in Figure 3, we can see the area reachable within a 1km walk of the same illustrative example store from Figure 2. It is no longer a perfect circle, as the catchment area now takes account of natural obstacles.
Figure 3: Example 1km walking distance catchment area
Source: Compass Lexecon analysis based on hypothetical data.
Following the breadcrumbs
Now let's consider a practical example of how these techniques could be used to assess competition at a local level. Suppose we have a hypothetical merger between Arepa Ltd and another high street retailer, Bagelco, and both companies sell similar types of bread.
Using our tools, we plot in Figure 4 below the locations of the Arepa Ltd (shown in dark blue) and Bagelco (shown in teal) points of sale in the areas surrounding Leeds and York in the UK. We also plot the three other competitors in the area, Croutoncorp, Breadcrumbs Ltd and Holy Crust.
Figure 4: Location of competing bread retailers in the Leeds and York local areas
Source: Compass Lexecon analysis based on hypothetical data.
We then run a target-centric analysis, in which we assume 20-minute drive time catchment areas around the target stores, i.e. Bagelco stores.[5] The graphical interpretation of these catchment areas is depicted in Figure 5 below.
Figure 5: Example of 20-minute drive time catchment areas centred on Bagelco stores in Leeds and York
Source: Compass Lexecon analysis based on hypothetical data.
Using this map, we can see which stores are in the catchment area of each Bagelco site and are therefore assumed to be competing for business. This allows us to compute market shares based on the competitor set present in the catchment area of each Bagelco store.
At its simplest these market shares are based on a count of the number of stores in each catchment area. As shown in Figure 5:
In the area around York, the acquirer Arepa Ltd is outside of the target catchment area, therefore on a target centric analysis the parties do not overlap.[6]If more information becomes available, e.g. on revenues, volume sold, etc., the analysis can be extended to account for these metrics. Using our tools, we can prepare interactive graphics in which we embed contextual information into our maps to help visualise key parameters of competition (such as the volume of baguettes sold in a local area), simply by clicking on the relevant point of sale.
A baker’s dozen of dozens: Rigour through multiple sensitivities
Our example shows that assumptions on the size of the catchment area (e.g. the travel time or the mode of transport) can have a material impact on the analysis, with in this case no target-based overlap in one of the two areas considered (York).
Therefore, the flexibility and computational power to conduct the analysis across multiple sensitivities is key to understanding the robustness of our findings.
The Compass Lexecon data science team has developed in-house tools to enable exactly this. For example, we can produce maps that allow our economists to adjust the boundaries of the local markets and analyse the market shares based on various sensitivities on the fly.
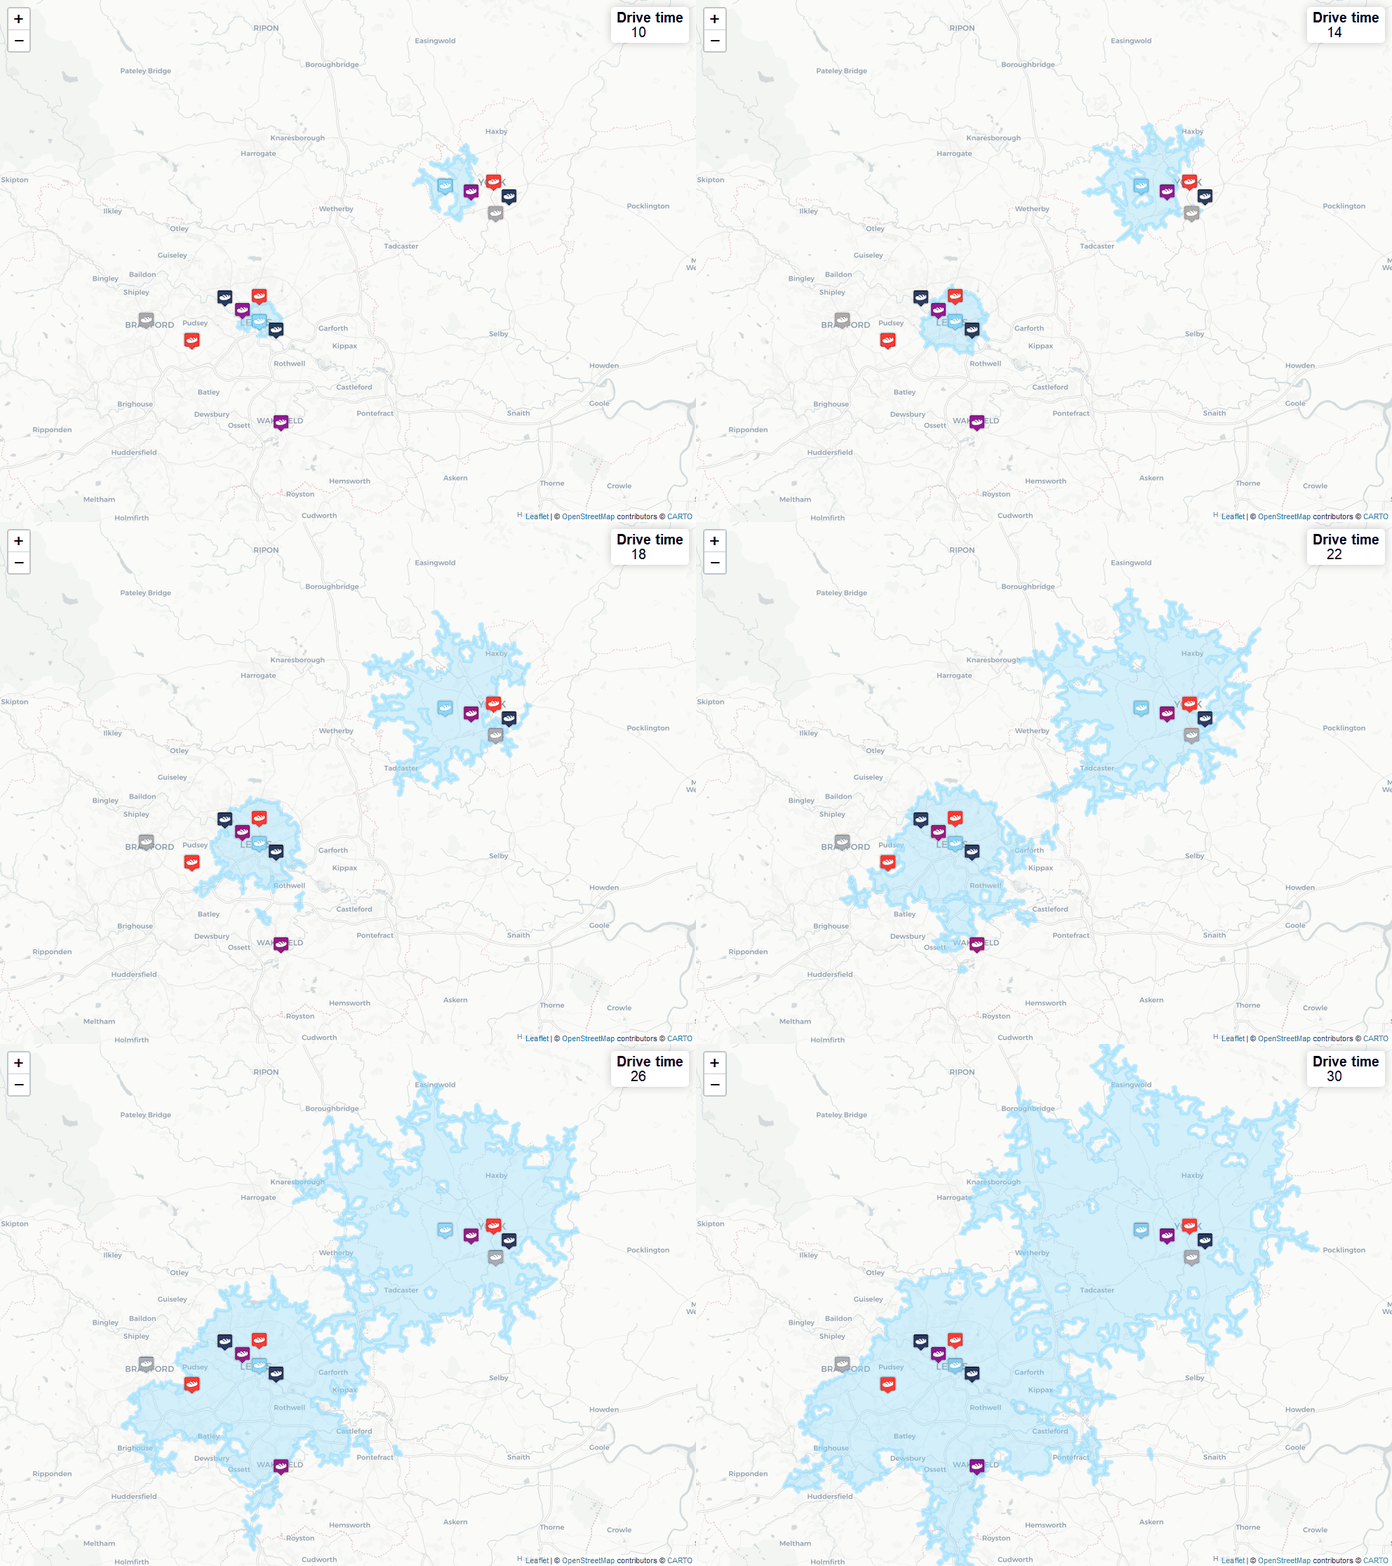
For illustrative purposes, Figure 6 below shows the catchment areas at drive times starting at 10 minutes and increasing in 1-minute increments to 30 minutes.[7]
This example demonstrates how influential drive times are to the resulting market shares:
a. At 10-minute drive time catchment areas, the target and acquirer point of sale do not overlap in either of the two areas considered.
b. At 20-minute drive time catchment areas, we observe an overlap in Leeds with the merged entity representing 60% of the stores, and no overlap in York.
c. At 30 minutes, the Parties’ combined market share is 43% in Leeds and 40% in York.
Figure 6: Visualising increasing drive times in local overlap analysis

We can also test catchment areas based on different transport modes. This might be relevant to capture differences in customers’ transport habits. For example, catchment areas in large cities can be based on walking distance or time, while catchment areas in rural areas can be based on driving time or distance. Moreover, we can also provide more novel types of mapping information such as cycling or public transport isochrones.
The interactive map in figure 7 shows how different modes of transport influence the resulting 20-minute catchment area.
Figure 7: Visualising 20-minute catchment areas with different modes of transport
Source: Compass Lexecon analysis based on hypothetical data.
With the use of our tools, our economists can design catchment areas according to the modes of transport which appear to be the most relevant and provide our clients with timely estimates of the outcomes of using various assumptions on the sizes of the catchment areas.
Conclusion: At the end of the road
The Compass Lexecon data science team was created to bring the latest developments in programming, machine learning and data analysis to economic consulting.
Sometimes this involves applying novel techniques to assess specific questions in an innovative and compelling way. For instance, running a sentiment analysis on social media content related to merging firms can be informative on their closeness of competition, and can supplement the results of a survey.
Other times it is about making work faster, more accurate, and more efficient, especially on cases which involve large datasets.
When it comes to geospatial analysis, the Compass Lexecon data science team has developed a set of in-house tools to:
Process geographical data and prepare maps at scale using internally developed tools;These tools should enable better analysis of the actual competitive pressures in different local markets, and thus better decisions by firms and competition authorities, to the benefit of economic development and to society as a whole.
About the Data Science Team
This short article is the part of a series of articles showcasing how data science can lead to more streamlined and robust economic analysis and ultimately to better decisions in competition cases. If you would like to find out more, please do not hesitate to reach out to us at datascience@compasslexecon.com.
[1] And similarly, reverse geocoding is the process of taking a set of coordinates and using them to determine the address.
[2] An application programming interface, or API, is a mechanism that enables two software components to communicate with each other using a set of definitions and protocols. APIs can be used to allow a software application to access the functionality of a different software application or service, or to access data from a database or other source.
[3] Competition authorities often use an 80% catchment area, in which the catchment area around a particular site is determined by the area around that site which accounts for 80% of its revenues. If the company has information on the location of its customers, for instance for subscribers to a loyalty program, the size of this area can easily be computed using the tools described above.
[4] For example, a 20-minute isochrone is a boundary portraying the area reachable within 20 minutes from a selected location.
[5] The convention among competition authorities is to draw catchment areas around the target firm (i.e. the firm being acquired).
[6] However, the opposite might be true (i.e., Bagelco could enter the catchment area of the Arepa Ltd store), for instance if there are one-ways streets affecting travel times between the points of sales of the two companies.
[7] We note that as the catchment area expands up to a 23-minute drive time, the two catchment areas overlap.


