Unleashing Champions: What European football tells us about globalisation, concentration and competition

Share
There is a debate on whether globalisation has caused an increase in market concentration globally, and what impact this has had on the intensity of competition. In this article, Lau Nilausen, Kristofer Hammarbäck and Max Mirtschink [1] investigate this idea by using the UEFA Champions League as an analogy and analyse how the rules governing player selection based on nationality has affected the competition between professional football clubs in Europe.
View the PDF version of this article.
The views expressed in this article are the views of the authors only and do not necessarily represent the views of Compass Lexecon, its management, its subsidiaries, its affiliates, its employees or its clients.
Article video summary
Introduction
In this article we consider the possibility that globalisation has caused increased market concentration across the economy, and has done so without necessarily lessening the intensity of competition. We explore this idea by way of analogy, analysing the competition between professional football clubs in Europe.
Like market competition, professional football is characterised by intense competition within a rule-based framework. Changes to the rules that regulate the competitive process between football teams influence both who succeeds and what it takes to succeed. In the late 1990s, there were two major changes to the rules that govern the competitive process between Europe’s best football clubs: the participation criteria for Europe’s premier club competition – the Champions’ League – and the European Court of Justice’s judgement in the Bosman case.
These rule changes removed barriers to competition. We show that the competitive forces that these changes unleashed increased the concentration of success around an emerging elite of strong clubs and at the same time intensified the competition between those clubs. Those changes made it harder for weak clubs to succeed. But they also made it harder for strong clubs to succeed. That is because removal of barriers to competition increased the strength of the competitors that any would-be winner had to overcome. Even if the star-studded Real Madrid once again reached glory in this year’s Champions League final they faced strong opposition by exceptional teams on their route to the title.
The professional football analogy provided another important insight that applies to market competition. The more that intense competition increases the level of performance or quality required to succeed at the top of the “game”, the fewer competitors are able to operate at that level. But the standard of what that elite produces may be greater because the increased strength of their opponents requires it. We show that this is true in football. And, we believe, it is likely true in markets too.
Debates about globalisation’s impact on competition
Globalisation has been increasing over the last decades. The WTO explains that while there is no universally agreed definition of globalisation, economists typically use the term to refer to international integration in commodity, capital and labour markets.[2] Under this interpretation, various indicators illustrate its rise. For instance:
- Trade as a percentage of world GDP increased from 25% to 57% between 1970 and 2021.[3]
- Foreign direct investment (FDI) inflows and outflows as a percentage of world GDP tripled over the period between 1970 and 2021.[4]
- The total international migrant stock increased by over 80% between 1990 and 2020.[5]
- Globalisation in its economic, social and political dimensions has risen since the 1970s according to the KOF Globalisation Index.[6]
- In the five largest European economies, across a wide set of industries, the market share of an industry’s four largest firms increased in more than 70% of industries over the 20 years up to 2020 with on average an increase of seven percentage points.[7]
- The average post-merger Herfindahl–Hirschman index (“HHI”, a measure of market concentration) in Europe for markets scrutinised by the European Commission in relation to merger assessments increased from around 2,500 in the mid-1990s to more than 3,000 in 2014.[8]
- Over the two decades leading up to 2014, the HHI has systematically increased in more than 75% of US industries, and the average increase of HHI in this period is 90%.[9]
Although the scale of this trend is debated, there is consensus that concentration has increased to some extent.[10] The main debate concerns why concentration has increased, and what it means for competition. Some observers suggest that concentration is the result of lax enforcement of competition rules.[11] On that basis, these observers argue that regulators should strive for more active competition enforcement. This appears to inform the regulatory philosophy promoted e.g., by Lina Khan at the FTC.[12] Other explanations proposed include technological change (such as digitisation and automation) and globalisation.[13]
The idea that increased globalisation may cause increases in market concentration is not new. Researchers have observed that lowering of trade barriers can promote the most efficient competitors at a local level to deploy their efficiency to international markets and thus grow on an international scale.[14]
Either way, the impact that increasing market concentration has on competition, and what it tells us about its intensity, has attracted attention from policymakers. For example, President Biden has issued an executive order aimed at promoting competition in the US economy to counteract the increase in market concentration.[15] Similarly, European Commission President von der Leyen has stated that focus should be directed at improving detection of competition cases, speeding up competition investigations and overall strengthening competition enforcement in all sectors.[16]
In summary, both globalisation and market concentration have been on upward trends across the global economy. We explore the potential implications for competition by way of analogy, analysing the competition between professional football clubs in Europe.
Unleashing competition in European football
The emergence of a successful elite of European football clubs was accelerated by two sets of institutional changes that came into force in the late 1990s. Here, we show how they reduced barriers to competition. First, we discuss how changes to the rules that govern who can participate in the Champions League – Europe’s premier club competition – effectively reduced barriers to entry, allowing more strong teams to compete. Second, we discuss how changes to the rules that govern who can play for a football club, brought about by the European Court of Justice’s judgement on the Bosman case, reduced barriers to trade that previously limited teams’ access to the best talent.
Participation in the Champions League
The Champions League seeks to determine the “best” football team in Europe. Founded in 1955 as the Coupe des Clubs Champions Européens (French for European Champion Clubs' Cup), it was commonly known as the European Cup and later renamed to the UEFA Champions League.[17] Currently, each year, 53 associations send one or more teams to participate in the tournament, mainly from Europe.[18] It is regarded as one of the most coveted and lucrative tournaments in the sporting world.[19]
The tournament’s format has varied over time but, essentially, the “best” teams from each of Europe’s domestic leagues compete with each other to determine an overall winner. It has generally consisted of a group stage followed by knockout rounds. Recently there have been pre-tournament knockout rounds to qualify for the main stage of the tournament.[20] In the current format, the qualifying rounds typically start in June, the main tournament commences in September, and the final is played in May.
Before the changes, the rules governing participation heavily favoured where a team came from over its ability to win football matches. From the tournament’s conception in 1955 up to and including 1996, only the teams that had won each of the participating associations’ domestic leagues were eligible to play in the Champions League. The only exception was the winner of the prior year’s Champions League, who was also allowed to compete if it had not won its domestic league as well.[21] However, Europe’s domestic leagues are not equally strong. So, under these rules, the champions of a weaker league qualified for the tournament, even though they were typically less good at football than teams placed second, third, or lower in a strong league.
From 1997, changes to the participation rules increasingly favoured teams based on their ability rather than where they came from.
- From 1997, the eight highest ranked domestic leagues were allowed to send two teams each to the tournament (or its qualifying rounds), [22] while the remaining leagues could send one team.[23]
- From 1999, the three highest ranked leagues (at the time Italy, Germany and Spain) were allowed to send four teams each, the leagues ranked four to six (at the time France, the Netherlands and England) were allowed to send three teams each, the leagues ranked seven to 15 were allowed to send two teams each, and the remaining leagues were allowed to send one team each.[24]
- From 2015, the winner of the second tier European-wide club tournament (the UEFA Europa League) is allowed to participate in the Champions League.[25]
The participation rule changes in 1997 and 1999 are particularly significant. They reduce barriers to entry, in the sense that they removed rules that had previously denied entry to teams that were likely to be competitive. These changes should therefore be prima facie pro-competitive (i.e., raise the standard of performance in the competition).[26]
The Bosman judgment
Prior to the 1995 Bosman judgment, there were strict limitations on the talent pool that football clubs could draw on. These took the form of constraints on the number of foreign nationals that each team could field in professional football matches. Before 1991, clubs could field no more than two “foreign nationals” during the same game. From 1991, the “3+2 rule” relaxed that restriction, allowing up to three foreign players and another two who had played in the country uninterrupted for five years, including at least three years as a junior.[27]
In 1990, Belgian footballer Jean-Marc Bosman brought a suit that essentially argued these restrictions were anti-competitive. He sued R.C. Liege (the Belgian club he played for), the Royal Belgian Football Association and UEFA arguing that the limits to fielding players on the basis of their nationality restricted football players’ freedom of movement, thus violating Article 48 of the Treaty.[28] Bosman alleged that due to the restrictive nationality rules he had been unable to secure a transfer to a different club after the end of his contract with R.C. Liege and was therefore personally harmed by the rules.[29]
The European Court of Justice in 1995 ruled in favour of Bosman, stating that the nationality rule had to be removed with respect to EU nationals (restrictions on non-EU nationals remain in place). It also ruled that football clubs were unable to charge transfer fees in instances where the player changed clubs after the end of the player’s contract with the club.[30] The ruling came into force in the 1996 season.
Bosman represented a significant reduction in trade barriers. For European players, Bosman increased the number of clubs to which they could sell their services. For clubs, Bosman opened the market to a much wider talent pool, enabling them to build a stronger team, comprising the best players available (in Europe), not the best players with a specific nationality.
Figure 1 illustrates the drastic impact of those changes by showing the number of foreign players fielded in the starting lineup of Champions League finalists since tournament conception in 1956. Before the rule changes, each team in the final typically fielded on average fewer than two foreign players. In the last 15 years, finalists have regularly fielded six foreign players or more.
Figure 1: Number of foreign players represented in Champions League finalists’ starting 11

Success is increasingly concentrated
The combined impact of these rule changes has resulted in increased concentration in the Champions League, in the sense that a group of elite clubs has emerged that are likely to succeed in tournament. Clubs outside that elite are much less likely to succeed than their counterparts were before the rule changes.
We illustrate this in several ways by taking “reaching the quarter final” as an indicator of “success”. It is a useful benchmark as it is a consistent stage of the tournament across format changes such that it enables comparison over time. Moreover, by that stage of the tournament the competition has played out and only eight teams remain.
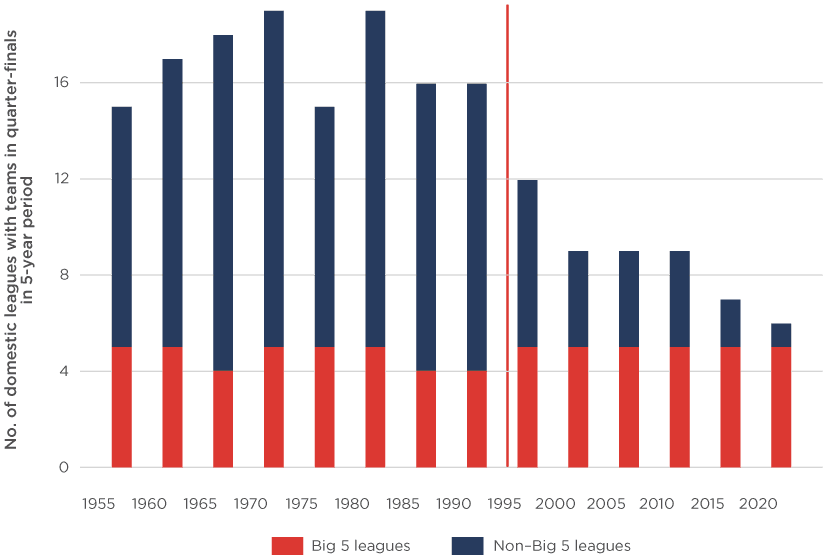
First, teams from weaker leagues are now much less likely to succeed. Each year UEFA ranks the strength of each European association’s league. Literature and media often refer to the strongest leagues as the “Big 5”: England, France, Germany, Italy and Spain.[31] Figure 2 shows that clubs from each of the Big 5 have reached the quarter-finals in every discrete five-year period since the rule changes. That is not a major change for these strong leagues. Other than a period when English clubs were banned from the competition following a crowd disaster at the 1985 final, clubs from each of the Big 5 consistently also reached the quarter final before the rule changes. However, before the rule changes the majority of quarter-finalists were from weaker leagues. Since 2000, few leagues outside the Big 5 are represented at that stage of the tournament.
Figure 2: Number of different domestic leagues from which clubs have reached the quarter-final in discrete five-year periods
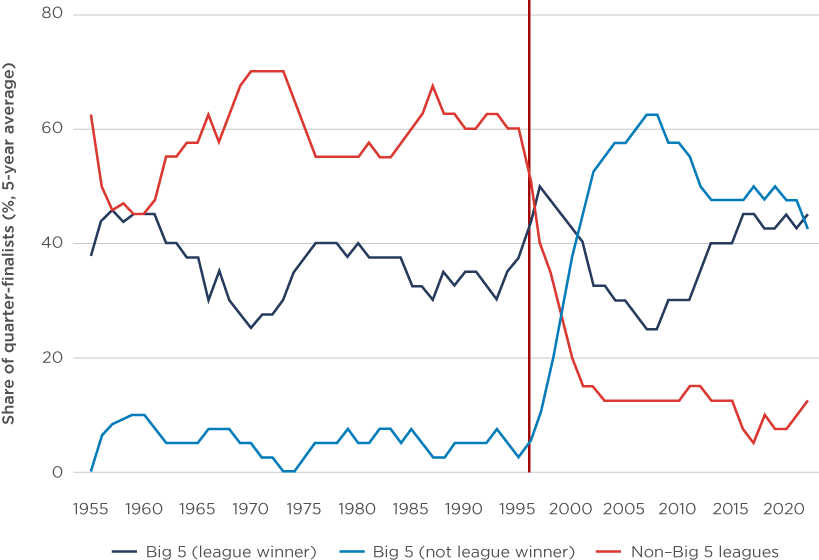
Second, the teams from weaker leagues have been eliminated – in a footballing sense, literally – by clubs from stronger leagues that rules had previously prevented from competing. Figure 3 shows the composition of quarter-finalists since the inaugural tournament – using a five-year rolling average to remove fluctuations that would obscure the underlying trend. Broadly, about 40% of quarter-finalists have consistently been winners of a Big 5 league. Immediately after the rule changes, the proportion of quarter-finalists from leagues outside the Big 5 plummeted from about 60% to under 20%. They have been replaced by teams from the Big 5 that had not won their domestic league the previous season. Prior to the rule changes, these clubs would have been ineligible to compete at all, unless the previous year they had won the Champions League itself (which is why Figure 3 shows that the proportion is not zero before the rule changes). After the rule changes, these clubs could compete on their merits. They may not have been champion of their (strong) domestic league. But they were good enough to succeed in the Champions League.
Figure 3: Share of teams in quarter-finals based on league affiliation
Successful clubs are not merely more likely to come from the Big 5. They are likely to be the same consistently strong clubs. Figure 4 shows the number of different teams that have reached the quarter-final stage over a five-year rolling period.[32] After the rule changes, significantly fewer clubs reach the quarterfinals in any given five year period. This suggests a decrease in the volatility of results, as more often the same teams would reach the quarter-finals in the period after the rule changes. In essence, an elite group more consistently succeeds.
Figure 4: Number of different teams in quarter-finals in the previous five years
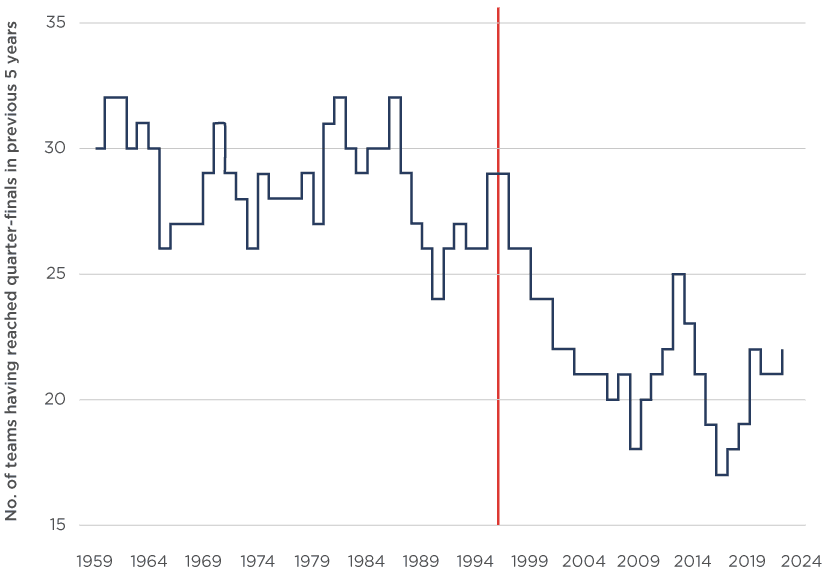
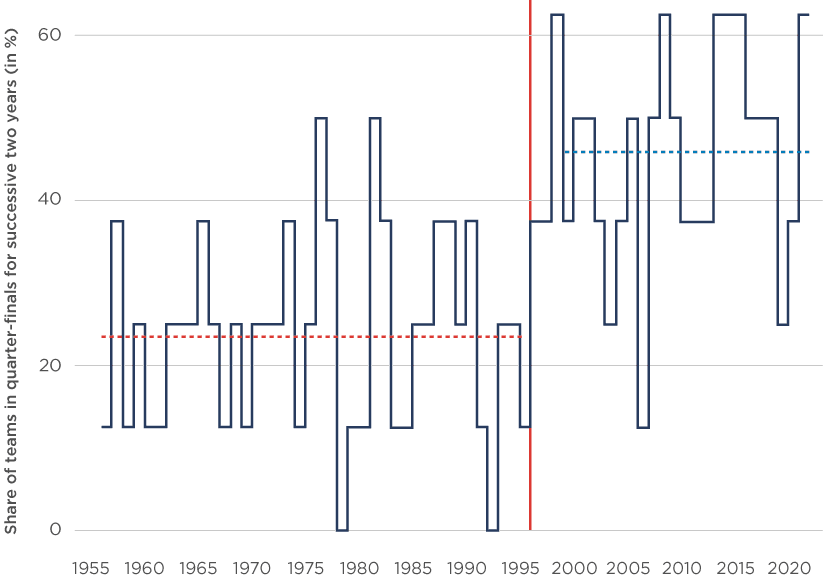
Figure 5 similarly indicates a reduction in volatility of teams’ performances in the Champions League quarter-finals following the participation rule changes and Bosman. In the period 1956-1995, on average 23% of teams in the quarter-finals had also reached the same stage in the previous year’s tournament. In the period 1999-2022, the equivalent number was 46%, showing a much stronger consistency of teams reaching later stages of the tournament.
Figure 5: Share of teams in quarter-finals which reached quarter-finals in the previous year
Bosman allows for a virtuous circle whereby successful teams can reinvest the resulting financial benefits into better players and thereby enhance their chances of future success. This self-enforcing mechanism of Bosman can be seen not only on the international level in the chart above but also on the domestic league level.
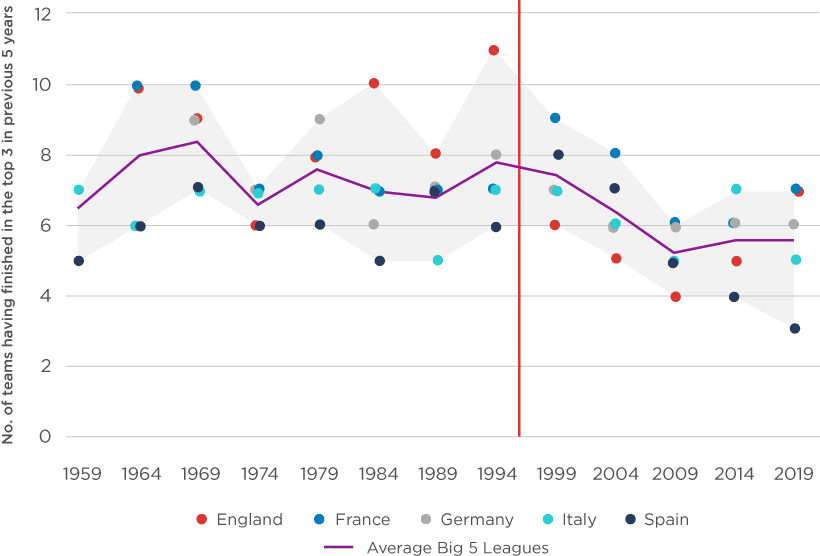
Figure 6 presents the number of different teams that were placed in the top three in a period of five years for the “Big 5” leagues. The graph shows a decrease in the number of different teams that managed to finish in the top three spots of the league, across all “Big 5” leagues. This points to a greater concentration of success in the domestic football leagues. Domestic leagues were notably not directly affected by the Champions League participation rule changes.[33] This result on the domestic level therefore better isolates any contribution of Bosman to the increased concentration of performance.
Figure 6: Number of different teams in top three pre- and post-Bosman for Big 5 leagues in discrete five-year periods
Increasing competition for success
The prior section establishes an increase in concentration of the performance of football clubs following Bosman and the participation rule changes. Here we highlight that an increase in concentration may imply an increase in the intensity of competition.
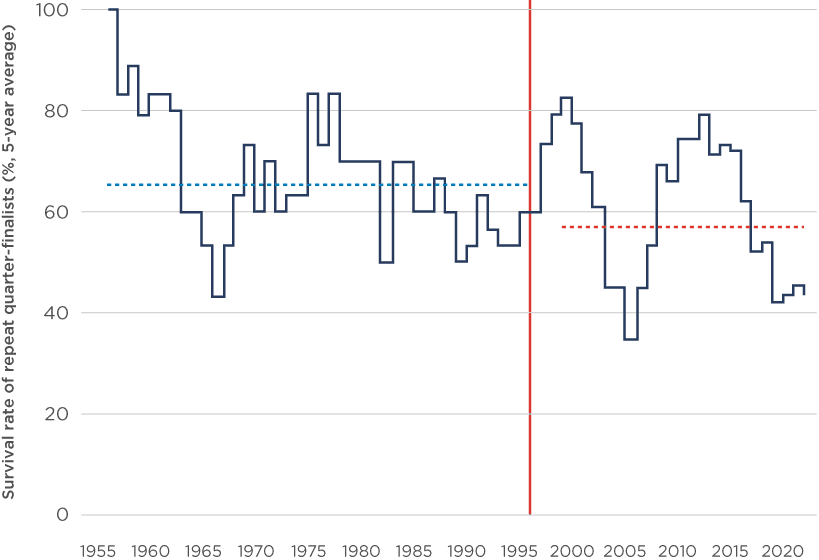
The Champions League is notoriously hard to win, even for very strong teams. In the past ten years, 11 distinct teams have contested the final. However, the nature of the competition means the composition of finalists may be naturally volatile. To get a more robust indicator on the competitive intensity elite clubs face we analyse their quarter-final “survival rate”. This rate, firstly, takes all teams that reach the quarter-finals who also reached the quarter-final in the previous year (thus are likely to be strong teams). Secondly, it measures the proportion of those teams that progress to the semi-final stage.
The survival rate reveals that consistently successful teams find it harder to progress further in the competition since the rule changes than their counterparts did before the changes. Figure 7 shows how the survival rate of repeat quarter-finalists has changed over time. Before 1996, 65.4% of these teams progressed to the semi-finals. Since 1999, the rate has fallen to 56.9% of these teams. This suggests that, following the institutional changes, a strong competitor faces more intense competition to reach the last stages of the tournament.
Figure 7: Share of repeat quarter-finalist teams progressing to semi-finals
Although the number of distinct successful teams has reduced, the competition between them for the ultimate prize has increased. This might surprise us, but it should not. The fact that more teams used to be successful is not a sign that competition used to be stronger. It is a sign that it was weak. Many teams are capable of success if the opponents they must overcome are not very strong. By removing barriers to competition, rule changes now mean that teams must be strong in order to succeed. It is trivial that weak teams struggle to overcome strong teams – the more important point is that so do other strong teams. The emergence of an intensely competitive European elite is a sign that competition works in football, not that it has failed.
Lessons for market competition
The competition between football clubs is not a perfect parallel for market competition. However, in some respects these results are instructive. They provide a fascinating analogy when considering the relationship between concentration and competition in economic markets that in our view provides two lessons that apply equally to market competition.
First, it is not necessarily the case that an increase in concentration leads to less intense competition to “win”. In football, success is more concentrated around an elite group of teams but none of them can “dominate” in the sense we use the term in competition law. Fierce competition is the domain of fewer but better competitors; it remains the case that no single team has “the power to behave to an appreciable extent independently of its competitors, customers and ultimately of its consumers” (or this case, its “fans”).[34]
Second, the analogy to professional football supports the idea that the general increase in global market concentration is a feature of globalisation intensifying competition, not a bug of lax antitrust enforcement allowing it to weaken. The higher the level of performance or quality at the top of the “game”, the fewer competitors are able to keep up. As the CJEU reminded us e.g. in Intel, “Competition on the merits may, by definition, lead to the departure from the market or the marginalisation of competitors that are less efficient and so less attractive to consumers from the point of view of, among other things, price, choice, quality or innovation".[35] Our assessment indicates that this is exactly what competition does – it creates concentration.
Ultimately, unleashing the ability of high-quality competitors to compete may well increase the quality of what the best competitors produce, even if the set of competitors that is able to deliver those standards shrinks. This is precisely what we see in the Champions League and may be what we see in markets too.
View the PDF version of this article.
Read all articles from this edition of The Analysis.
References
-
Kristofer Hammarback is a Senior Economist, Lau Nilausen is a Senior Vice President, and Max Mirtschink is a Senior Analyst at Compass Lexecon. The authors gratefully acknowledge the contribution of Haris Spyrou. The authors thank Andrew Tuffin for his comments. The views expressed in this article are the views of the authors only and do not necessarily represent the views of Compass Lexecon, its management, its subsidiaries, its affiliates, its employees or its clients.
-
World Trade Organization (2008) World Trade Report 2008 Trade in a Globalizing World, p. 41.
-
The World Bank. See https://data.worldbank.org/ind..., last accessed on 29 April 2024.
-
The World Bank. See https://data.worldbank.org/ind..., last accessed on 29 April 2024 and https://data.worldbank.org/ind...,
last accessed on 29 April 2024.
-
International migrant stock being the number of international migrants estimated using population censuses. See https://www.un.org/development..., file ‘International Migrant Stock 2020’, tab ‘Table 1’, cells T12:Z18, last accessed on 29 April 2024.
-
Gygli, S., Haelg, F., Potrafke, N., & Sturm, J. E. (2019) “The KOF globalisation index–revisited.” The Review of International Organizations, 14, 543-574. For an informal overview, see also https://kof.ethz.ch/en/forecas..., last accessed on 29 April 2024.
-
The European economies referred to are France, Germany, Italy, Spain and the UK. Koltay, G., Lorincz, S., & Valletti, T. (2023) “Concentration and competition: Evidence from Europe and implications for policy.” Journal of Competition Law & Economics, 19(3), 466-501.
-
Affeldt, P., Duso, T., Gugler, K. P., & Piechucka, J. (2021) “Market concentration in Europe: Evidence from antitrust markets”, p. 13.
-
Grullon, G., Larkin, Y., & Michaely, R. (2019) “Are US industries becoming more concentrated?” Review of Finance, 23(4), 697-743, p. 1.
-
For a summary of the debate and an analysis, see Ian Small, “What do markups tell us about competition and merger control in Europe?” https://www.compasslexecon.com..., last accessed 29 April 2024.
-
“Politicians, advocacy groups, academics, and journalists have all questioned whether the failure of antitrust is to blame for declining competition, and whether the law must be reformed in order to tackle the monopoly problems of the twenty-first-century". Khan, L. M. (2017) “The ideological roots of America's market power problem.” Yale LJF, vol. 127, p. 960.
-
For example, in context of big tech antitrust conduct, Khan stated during a Senate hearing that the US needs “a different set of rules”. ‘Different set of rules’: how FTC head Lina Khan is fighting tech giants such as Amazon”, 27 September 2023. See https://www.theguardian.com/te..., last accessed 29 April 2024.
-
Autor, D., Dorn, D., Katz, L. F., Patterson, C., & Van Reenen, J. (2020) “The fall of the labor share and the rise of superstar firms.” The Quarterly Journal of Economics, 135(2), 645-709.
-
See for example Impullitti, G., & Kazmi, F. (2023) “Globalization and market power”, working paper. Available at SSRN: https://ssrn.com/abstract=4333..., last accessed 29 April 2024.
-
See https://www.gspublishing.com/c..., last accessed on 29 April 2024.
-
President von der Leyen’s mission letter addressed to Margrethe Vestager, 1 December 2019, see https://commissioners.ec.europ..., last accessed on 29 April 2024.
-
See, https://www.uefa.com/uefachamp..., last accessed on 29 April 2024.
-
The UEFA (Union of European Football Associations) is the head organisation of 55 football associations. Football associations that are members even though partially or entirely outside Europe include eight countries: Armenia, Azerbaijan, Cyprus, Georgia, Israel, Kazakhstan, Russia and Turkey. Liechtenstein is a member association but does not meet the requirements to participate as there is no domestic league. Russia has been banned from competing since 2023. See https://www.uefa.com/insideuef..., last accessed on 29 April 2024.
-
The prize fund for the 32 clubs participating in the tournament’s group stage onwards stands at €2.002bn. Union of European Football Associations (2023) Distribution to clubs from the 2023/24 UEFA Champions League, UEFA Europa League and UEFA Europa Conference League and the 2023 UEFA Super Cup.
-
The first time the tournament included a qualifying round prior to the group stage was for the 1992-93 season. See https://www.footballhistory.or..., last accessed on 29 April 2024.
-
See https://historic.myfootballfac..., last accessed on 29 April 2024. In these instances, the domestic association which the prior year winning club represents were allowed to have two participating teams (if the prior year Champions League winner also won the domestic league, the runner-up of the domestic league was allowed to participate).
-
See https://historic.myfootballfac..., last accessed on 29 April 2024. The rules for how many teams an association could send to the main stages of the tournament or the qualifying rounds have varied over time.
-
In current format, each participating league has an association club coefficient (‘country ranking’) that captures the past performance of all clubs in the association in the Champions League. The coefficient is calculated as an average of the last five seasons, allocating more weight to the more recent seasons. See https://www.uefa.com/nationala..., last accessed on 29 April 2024.
-
See https://kassiesa.net/uefa/hist..., last accessed on 29 April 2024.
-
See https://fr.uefa.com/uefaeuropa..., last accessed on 29 April 2024.
-
In fact, regarding the 1997 changes, UEFA noted at the time that as more top teams are eligible to join the Champions League, the standard of the competition would be raised: “[t]his makes the competition more open and ensures that teams from all nations can qualify, while also raising the standard of the competition”. “Setting the standard for club football”, 20 April 2020. See https://www.uefa.com/uefachamp..., last accessed 29 April 2024.
-
See Bosman judgement, para. 27.
-
Article 48 (now article 45 of the TFEU) permitted Member State national workers to move freely between Member State countries to seek and take up employment. See https://assets.publishing.serv..., paragraph 9, last accessed on 29 April 2024.
-
Closson, P. (1998) “Penalty Shot: The European Union's Application of Competition Law to the Bosman Ruling”, Boston College International and Comparative Law Review, vol. 21, p. 167.
-
See Bosman judgement, point 1 of the Court’s ruling.
-
Since 2002, England, Germany, Italy and Spain were always ranked by UEFA among the top five associations, and France was mostly ranked among the top five (77% of annual rankings in this period). The term “Big 5” is also frequently used in academic articles (see Santeri (2018), Miao et al. (2015) Littlewood (2011)) and other domains (“Carlo Ancelotti 'proud' after making history as first manager to win top-flight title in all of the 'big five' European leagues as Real Madrid wrap up La Liga crown with victory over Espanyol”, 30 April 2022. See https://www.dailymail.co.uk/sp..., last accessed on 29 April 2024.
-
For example, the value for 2010 shows the sum of different teams that reached the quarter-finals of the tournament in the seasons between 2006 and 2010 inclusive.
-
Other facts may also contribute to these developments, such as changes to the distribution of television revenues across teams in a domestic league.
-
Communication from the Commission — Guidance on the Commission's enforcement priorities in applying Article 82 of the EC Treaty to abusive exclusionary conduct by dominant undertakings, 2009/C 45/02, para. 10.
-
See Case C-413/14 P Intel v Commission EU:C:2017:632, para. 134.